【 MATLAB 】stairs 函数介绍_matlab stairs函数用法-程序员宅基地
技术标签: # C/Linux/Tcl/Matlab 区
stairs
Stairstep graph
Syntax
stairs(Y)
stairs(X,Y)
stairs(___,LineSpec)
stairs(___,Name,Value)
stairs(ax,___)
h = stairs(___)
[xb,yb] = stairs(___)
Description
stairs( draws a stairstep graph of the elements in Y)Y.
-
If
Yis a vector, thenstairsdraws one line. -
If
Yis a matrix, thenstairsdraws one line per matrix column.
stairs( plots the elements in X,Y)Y at the locations specified by X. The inputs X and Y must be vectors or matrices of the same size. Additionally, X can be a row or column vector and Y must be a matrix with length(X) rows.
stairs(___, specifies a line style, marker symbol, and color. For example, LineSpec)':*r' specifies a dotted red line with asterisk markers. Use this option with any of the input argument combinations in the previous syntaxes.
stairs(___, modifies the stairstep chart using one or more name-value pair arguments. For example,Name,Value)'Marker','o','MarkerSize',8 specifies 8 point circle markers.
stairs( plots into the axes specified by ax,___)ax instead of into the current axes (gca). The option, ax, can precede any of the input argument combinations in the previous syntaxes.
stairs(绘制成由ax指定的轴而不是当前轴(gca)。 选项ax可以在先前语法中的任何输入参数组合之前。ax,___)
h = stairs(___)Stair objects. Use h to make changes to properties of a specific Stair object after it is created.
h = stairs(___)
[ does not create a plot, but returns matrices xb,yb] = stairs(___)xb and yb of the same size, such that plot(xb,yb) plots the stairstep graph.
[不会创建绘图,但返回相同大小的矩阵xb和yb,以便绘图(xb,yb)绘制阶梯图。xb,yb] = stairs(___)
Plot Single Data Series
Create a stairstep plot of sine evaluated at 40 equally spaced values between 0 and.
X = linspace(0,4*pi,40);
Y = sin(X);figure
stairs(Y)
The length of Y automatically determines and generates the x-axis scale.

Plot Multiple Data Series
Create a stairstep plot of two cosine functions evaluated at 50 equally spaced values between 0 and
X = linspace(0,4*pi,50)';
Y = [0.5*cos(X), 2*cos(X)];figure
stairs(Y)
The number of rows in Y automatically determines and generates the x-axis scale.

Plot Single Data Series at Specified x-Values
Create a stairstep plot of a sine wave evaluated at equally spaced values between 0 and
X = linspace(0,4*pi,40);
Y = sin(X);figure
stairs(X,Y)
The entries in Y are plotted against the corresponding entries in X.

Plot Multiple Data Series at Specified x-Values
Create a stairstep plot of two cosine waves evaluated at equally spaced values between 0 and
X = linspace(0,4*pi,50)';
Y = [0.5*cos(X), 2*cos(X)];figure
stairs(X,Y)
The first vector input, X, determines the x-axis positions for both data series.

Plot Multiple Data Series at Unique Sets of x-Values
Create a stairstep plot of two sine waves evaluated at different values. Specify a unique set of x-values for plotting each data series.
x1 = linspace(0,2*pi)';
x2 = linspace(0,pi)';
X = [x1,x2];
Y = [sin(5*x1),exp(x2).*sin(5*x2)];figure
stairs(X,Y)
Each column of X is plotted against the corresponding column of Y.

Specify Line Style, Marker Symbol and Color
Create a stairstep plot and set the line style to a dot-dashed line, the marker symbol to circles, and the color to red.
X = linspace(0,4*pi,20);
Y = sin(X);
figure
stairs(Y, '-.or')

Specify Additional Style Options
Create a stairstep plot and set the line width to 2, the marker symbols to diamonds, and the marker face color to cyan using Name,Value pair arguments.
X = linspace(0,4*pi,20);
Y = sin(X);
figure
stairs(Y,'LineWidth',2,'Marker','d','MarkerFaceColor','c')

Specify Axes for Stairstep Plots
Create a figure with two subplots and return the two axes handles, s(1) and s(2). Create a stairstep plot in each subplot by referring to the axes handles.
figure
s(1) = subplot(2,1,1);
s(2) = subplot(2,1,2);
X = linspace(0,2*pi);
Y1 = 5*sin(X);
Y2 = sin(5*X);
stairs(s(1),X,Y1)
stairs(s(2),X,Y2)

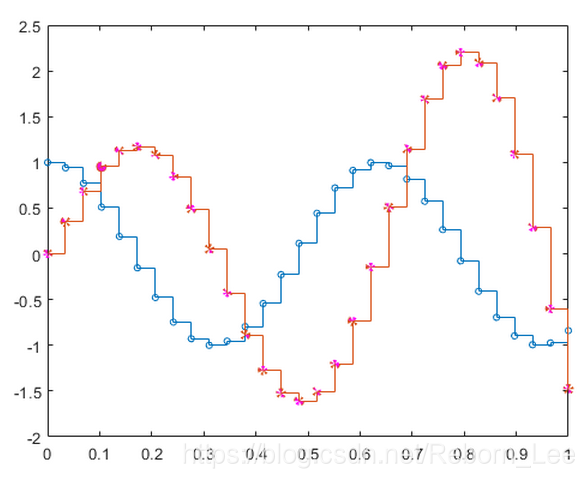
Modify Stairstep Plot After Creation
Create a stairstep plot of two data series and return the two stair objects.
X = linspace(0,1,30)';
Y = [cos(10*X), exp(X).*sin(10*X)];
h = stairs(X,Y);

Use small circle markers for the first data series. Use magenta filled circles for the second series. Starting in R2014b, you can use dot notation to set properties. If you are using an earlier release, use the docid:matlab_ref.f67-432995 function instead.
h(1).Marker = 'o';
h(1).MarkerSize = 4;
h(2).Marker = 'o';
h(2).MarkerFaceColor = 'm';
Create a Stairstep Plot using plot Function
Evaluate two cosine functions at 50 equally spaced values between 0 and and create a stairstep plot using plot.
X = linspace(0,4*pi,50)';
Y = [0.5*cos(X), 2*cos(X)];
[xb,yb] = stairs(X,Y);
stairs returns two matrices of the same size, xb and yb, but no plot.
Use plot to create the stairstep plot with xb and yb.
figure
plot(xb,yb)
智能推荐
while循环&CPU占用率高问题深入分析与解决方案_main函数使用while(1)循环cpu占用99-程序员宅基地
文章浏览阅读3.8k次,点赞9次,收藏28次。直接上一个工作中碰到的问题,另外一个系统开启多线程调用我这边的接口,然后我这边会开启多线程批量查询第三方接口并且返回给调用方。使用的是两三年前别人遗留下来的方法,放到线上后发现确实是可以正常取到结果,但是一旦调用,CPU占用就直接100%(部署环境是win server服务器)。因此查看了下相关的老代码并使用JProfiler查看发现是在某个while循环的时候有问题。具体项目代码就不贴了,类似于下面这段代码。while(flag) {//your code;}这里的flag._main函数使用while(1)循环cpu占用99
【无标题】jetbrains idea shift f6不生效_idea shift +f6快捷键不生效-程序员宅基地
文章浏览阅读347次。idea shift f6 快捷键无效_idea shift +f6快捷键不生效
node.js学习笔记之Node中的核心模块_node模块中有很多核心模块,以下不属于核心模块,使用时需下载的是-程序员宅基地
文章浏览阅读135次。Ecmacript 中没有DOM 和 BOM核心模块Node为JavaScript提供了很多服务器级别,这些API绝大多数都被包装到了一个具名和核心模块中了,例如文件操作的 fs 核心模块 ,http服务构建的http 模块 path 路径操作模块 os 操作系统信息模块// 用来获取机器信息的var os = require('os')// 用来操作路径的var path = require('path')// 获取当前机器的 CPU 信息console.log(os.cpus._node模块中有很多核心模块,以下不属于核心模块,使用时需下载的是
数学建模【SPSS 下载-安装、方差分析与回归分析的SPSS实现(软件概述、方差分析、回归分析)】_化工数学模型数据回归软件-程序员宅基地
文章浏览阅读10w+次,点赞435次,收藏3.4k次。SPSS 22 下载安装过程7.6 方差分析与回归分析的SPSS实现7.6.1 SPSS软件概述1 SPSS版本与安装2 SPSS界面3 SPSS特点4 SPSS数据7.6.2 SPSS与方差分析1 单因素方差分析2 双因素方差分析7.6.3 SPSS与回归分析SPSS回归分析过程牙膏价格问题的回归分析_化工数学模型数据回归软件
利用hutool实现邮件发送功能_hutool发送邮件-程序员宅基地
文章浏览阅读7.5k次。如何利用hutool工具包实现邮件发送功能呢?1、首先引入hutool依赖<dependency> <groupId>cn.hutool</groupId> <artifactId>hutool-all</artifactId> <version>5.7.19</version></dependency>2、编写邮件发送工具类package com.pc.c..._hutool发送邮件
docker安装elasticsearch,elasticsearch-head,kibana,ik分词器_docker安装kibana连接elasticsearch并且elasticsearch有密码-程序员宅基地
文章浏览阅读867次,点赞2次,收藏2次。docker安装elasticsearch,elasticsearch-head,kibana,ik分词器安装方式基本有两种,一种是pull的方式,一种是Dockerfile的方式,由于pull的方式pull下来后还需配置许多东西且不便于复用,个人比较喜欢使用Dockerfile的方式所有docker支持的镜像基本都在https://hub.docker.com/docker的官网上能找到合..._docker安装kibana连接elasticsearch并且elasticsearch有密码
随便推点
Python 攻克移动开发失败!_beeware-程序员宅基地
文章浏览阅读1.3w次,点赞57次,收藏92次。整理 | 郑丽媛出品 | CSDN(ID:CSDNnews)近年来,随着机器学习的兴起,有一门编程语言逐渐变得火热——Python。得益于其针对机器学习提供了大量开源框架和第三方模块,内置..._beeware
Swift4.0_Timer 的基本使用_swift timer 暂停-程序员宅基地
文章浏览阅读7.9k次。//// ViewController.swift// Day_10_Timer//// Created by dongqiangfei on 2018/10/15.// Copyright 2018年 飞飞. All rights reserved.//import UIKitclass ViewController: UIViewController { ..._swift timer 暂停
元素三大等待-程序员宅基地
文章浏览阅读986次,点赞2次,收藏2次。1.硬性等待让当前线程暂停执行,应用场景:代码执行速度太快了,但是UI元素没有立马加载出来,造成两者不同步,这时候就可以让代码等待一下,再去执行找元素的动作线程休眠,强制等待 Thread.sleep(long mills)package com.example.demo;import org.junit.jupiter.api.Test;import org.openqa.selenium.By;import org.openqa.selenium.firefox.Firefox.._元素三大等待
Java软件工程师职位分析_java岗位分析-程序员宅基地
文章浏览阅读3k次,点赞4次,收藏14次。Java软件工程师职位分析_java岗位分析
Java:Unreachable code的解决方法_java unreachable code-程序员宅基地
文章浏览阅读2k次。Java:Unreachable code的解决方法_java unreachable code
标签data-*自定义属性值和根据data属性值查找对应标签_如何根据data-*属性获取对应的标签对象-程序员宅基地
文章浏览阅读1w次。1、html中设置标签data-*的值 标题 11111 222222、点击获取当前标签的data-url的值$('dd').on('click', function() { var urlVal = $(this).data('ur_如何根据data-*属性获取对应的标签对象